📊 Study Analytics

See Exactly How You Study.
Then Study Better.

Most students study hard without knowing where their time actually goes. BoardOS Analytics Dashboard turns study habits into clear data — so you can optimise your effort and work towards high CBSE scores.

📈
+4.5h
vs. Last Week

Example student's week-over-week study hour change

Why Analytics Matters

Stop Guessing. Start Knowing.

Every CBSE student thinks they're studying "enough" — until the data says otherwise. BoardOS Analytics turns vague effort into a clear, honest picture of your preparation.

  • Spot the subjects you're quietly avoiding before they become a crisis
  • See your quiz accuracy trend rising (or falling) chapter by chapter
  • Know your board exam readiness score at a glance, not a guess
  • Export a clean report to share with parents or teachers
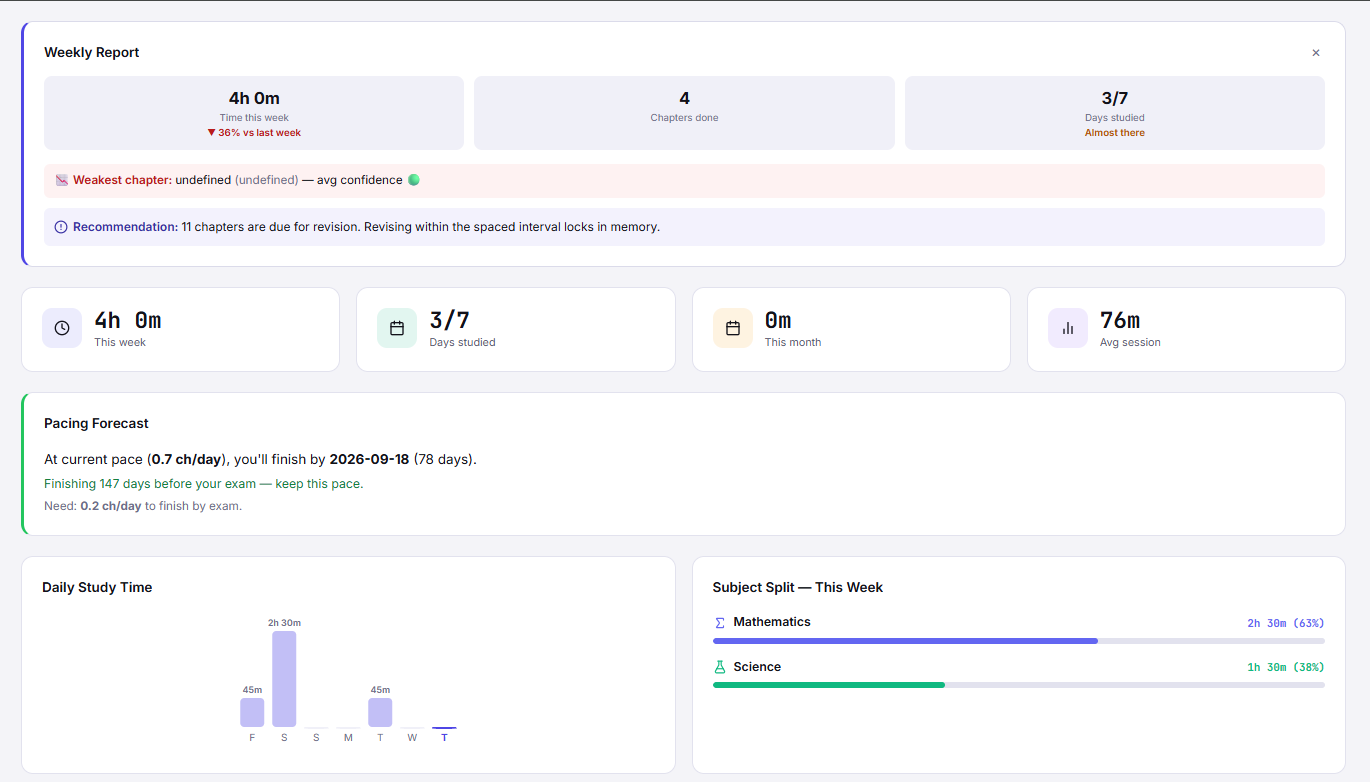
BoardOS Study Analytics Dashboard — Weekly report, pacing forecast, subject split

Your Week at a Glance — real numbers, real insights, updated automatically.

Dashboard Features

Every Study Metric You Actually Need

BoardOS turns raw study activity into a dashboard built specifically for CBSE board exam prep.

⏱️

Subject-Wise Study Hours

See time distribution across all CBSE subjects. Spot the subjects you're avoiding and reallocate effort before it's too late.

📈

Quiz Performance Trends

Track accuracy improvement per chapter and subject over days, weeks, and months. Know exactly which chapters are getting stronger.

🗓️

Study Calendar Heatmap

A calendar heatmap of your daily study activity. Visually see your consistency and spot gaps before they become habits.

🎯

Board Exam Readiness Score

A composite score combining syllabus completion, quiz accuracy, and revision coverage — updated daily as you study.

🧠

Peak Productivity Hours

Discover when you study most effectively. Schedule future sessions at your proven peak hours for maximum output.

📤

Shareable Weekly Report

Export or share a weekly summary with parents or teachers. Builds accountability and keeps everyone aligned.

Time by Subject — This Week

38.5h total

Sample Data View

Your Week at a Glance — Real Numbers, Real Insights

Here's what a sample BoardOS Analytics snapshot looks like for a Class 12 Science student. Biology is falling behind everything else — exactly the kind of imbalance this view is built to surface.

  • Bars update live as you log sessions — no manual entry needed
  • Red bars flag subjects under 30% of your weekly target
  • Tap any subject to drill into chapter-level time breakdown

FAQ

Analytics Dashboard — Your Questions Answered

What data does the BoardOS Analytics Dashboard show?
The dashboard shows total study hours by subject, daily and weekly study patterns, quiz accuracy trends, revision completion rates, syllabus progress percentages, streak history, and an overall board exam readiness score.
Can the analytics help me identify which subjects I'm neglecting?
Yes. BoardOS compares time spent across all subjects and flags imbalances — for example, if you've logged 10 hours of Maths but only 2 hours of Chemistry over the same week.
How is study time tracked in BoardOS?
Study time is tracked automatically via the Focus Timer. Every time you start a focus session and link it to a subject/chapter, the time is logged. Manual entries are also possible.
Can I share my analytics report with my parents or teacher?
Yes. You can export a weekly or monthly analytics report as a PDF or shareable link. It shows study hours, quiz scores, and progress — great for parent-teacher meetings.
Does the dashboard show me my best study times?
Yes. BoardOS analyses when during the day you complete the most sessions and perform best on quizzes, then suggests these as your peak study hours for scheduling future sessions.

You Can't Improve What You Don't Measure.

Start tracking your study data today and turn effort into actual exam results.